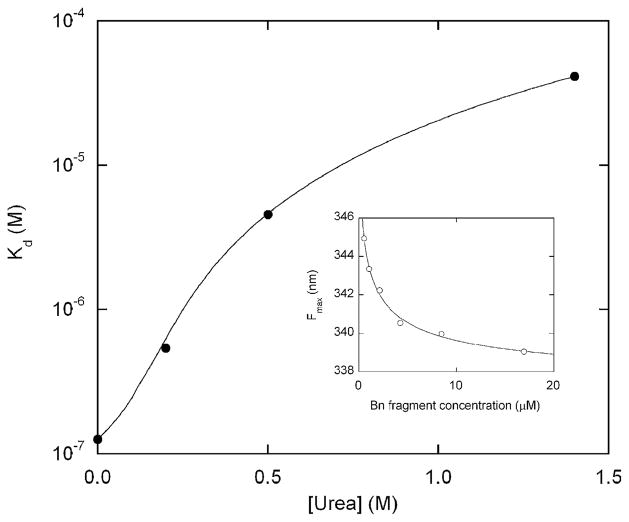
Figure 3.
Urea dependence of the apparent dissociation constant for intermolecular complementation (Bn fragments 1–67 and 68–110). The line is meant to guide the eye only. Various concentrations of 1–67 and 68–110 Bn fragments (always present at a 1:1 ratio) were unfolded in 6 M urea then rapidly diluted to the urea concentration indicated. Refolding of the complex was monitored by shift in Trp fluorescence maximum (inset; data obtained in 0.2 M urea). Kd values were obtained by fitting fluorescence maxima to the simple 1:1 binding equation (continuous line in the inset indicates curve fit). Solution conditions are the same for Figure 2. Bn fragments 1–67 and 68–110 were prepared by digesting purified S67M mutant with CNBr.18

