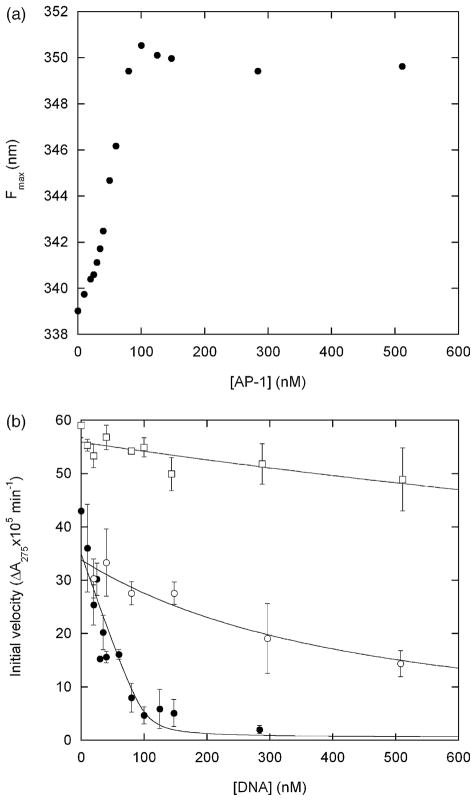
Figure 4.
(a) DNA binding-induced unfolding of the Bn domain of BG monitored by Trp fluorescence maximum. Samples were incubated with for 2 h with AP-1 oligonucleotide (5′-AGTGGAGATGACTCATCTCGTGC-3′) prior to measurements. (b) Inhibition of RNase activity by DNA binding. Filled and open circles designate BG incubated with AP-1 and with the non-consensus oligonucleotide 5′-CAGGGTGCTATGAACAAATGCCTCGAGCTGTTCCG T-3′, respectively. Open squares represent free Bn incubated with AP-1. Lines are best fits of the data to the simple binding equation. Fitted Kd values are ~2 nM (filled circles), 360 nM (open circles) and ~3 μM (open squares). Error bars represent standard deviations of three measurements. Samples were prepared as for (a) and assayed for RNase activity by addition of 20 μM guanylyl(3′-5′)uridine 3′-monophosphate.19 Substrate transesterification was monitored by absorbance at 275 nm on a Cary 100 spectrophotometer (Varian Instruments). Initial velocities were obtained from least-squares fits of the linear portion of the data. The concentration of free Bn was reduced to 60 nM to lower the initial velocity to measurable levels. Conditions are identical to those for Figure 2 except 1.4 M urea is present in all samples, and samples for enzyme assays contain 0.1 mg ml−1 bovine.

