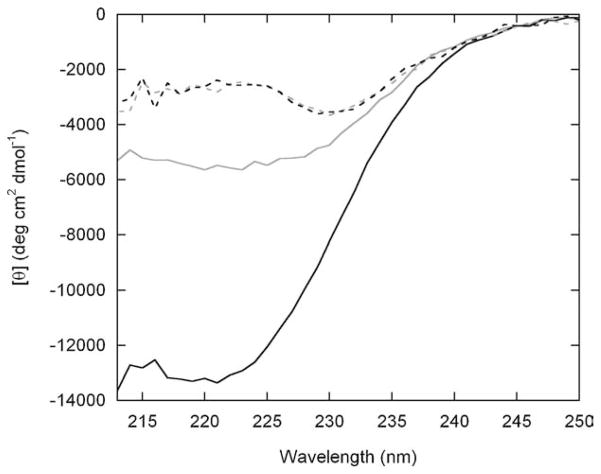
Figure 5.
CD spectra of free Bn (broken lines) and BG (continuous lines) in the absence (grey) and presence (black) of AP-1 DNA. Protein and AP-1 concentrations were 0.50 μM and 0.94 μM, respectively. The black traces were generated by subtracting spectra of free AP-1 at the same concentration. Solution conditions are identical to those for Figure 4. Data were collected on a model 202 spectropolarimeter (Aviv Biomedical, Inc.) in a 1 cm × 1 cm cuvette. Wavelengths below 212 nm are not shown due to excessive sample absorbance.

