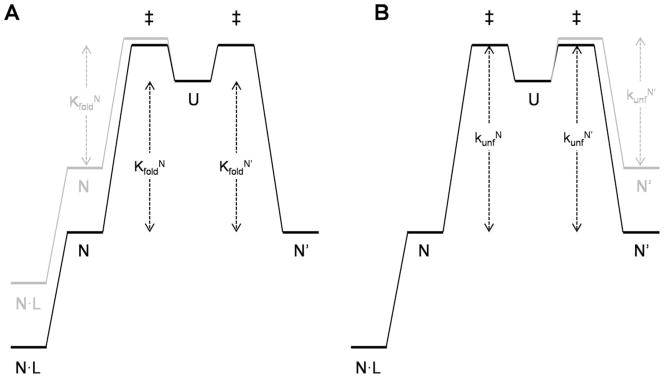
Figure 2.
Free energy diagrams of the minimal three-state model for fold switching. Vertical arrows indicate free energy changes; RT and logarithm terms are omitted for clarity. Represented in black are the free energy levels of Q65 and Q65′, in which the stabilities of N and N′ are approximately equal(KfoldN =KfoldN′). Ligand binding to N is shown (e.g., the Q65′ variant). (A) The effect of introducing a destabilizing mutation into N, depicted in gray, is to decrease binding affinity and increase fluorescence change. (B) The effect of introducing a destabilizing mutation into N′, shown in gray, is to decrease the height of the rate-limiting barrier (KunfN′).

