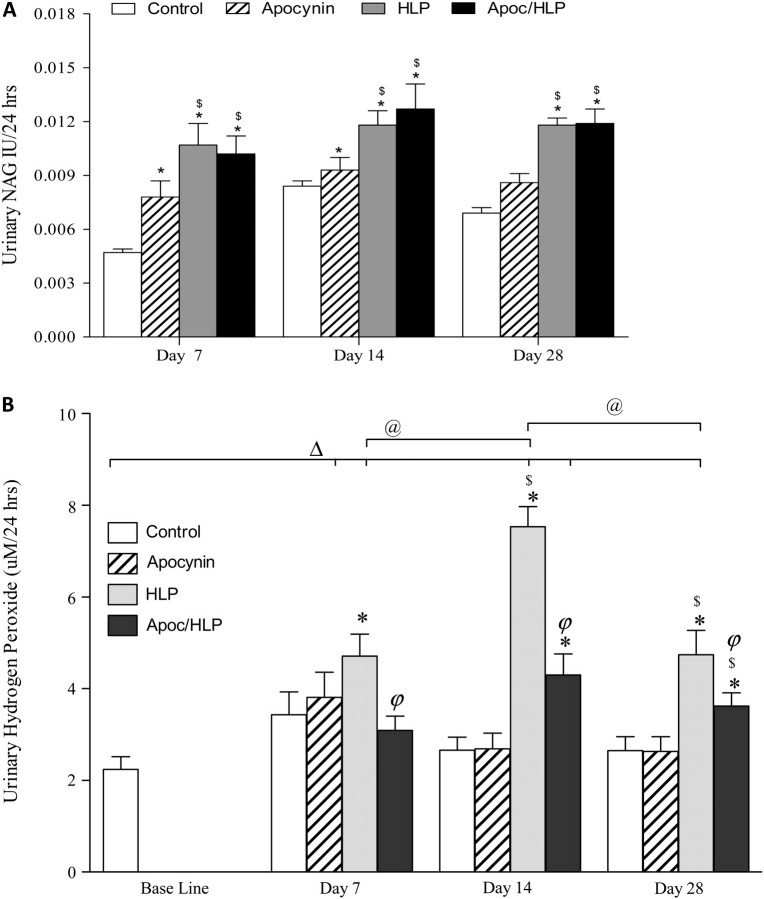
Fig. 2.
Sign of injury in the urine. (A) Urinary excretion of NAG increased significantly by HLP consumption for all time periods. Apocynin treatment had no effect on NAG excretion. *P < 0.05 control versus HLP and HLP/Apoc within the time period. $P < 0.05 apocynin treated versus HLP consumption alone within the time period. (B) There was a significant increase in urinary HP excretion, which was significantly reduced by apocynin treatment. ΔP < 0.05 baseline versus HLP and HLP/Apoc on different days. @P < 0.05 HLP between various days. P < 0.05 HLP/Apoc between different days. *P < 0.05 control versus HLP and HLP/Apoc within the time period. $P < 0.05 apocynin treated versus HLP consumption alone within the time period. φP < 0.05 HLP versus HLP/Apoc within the time period.

