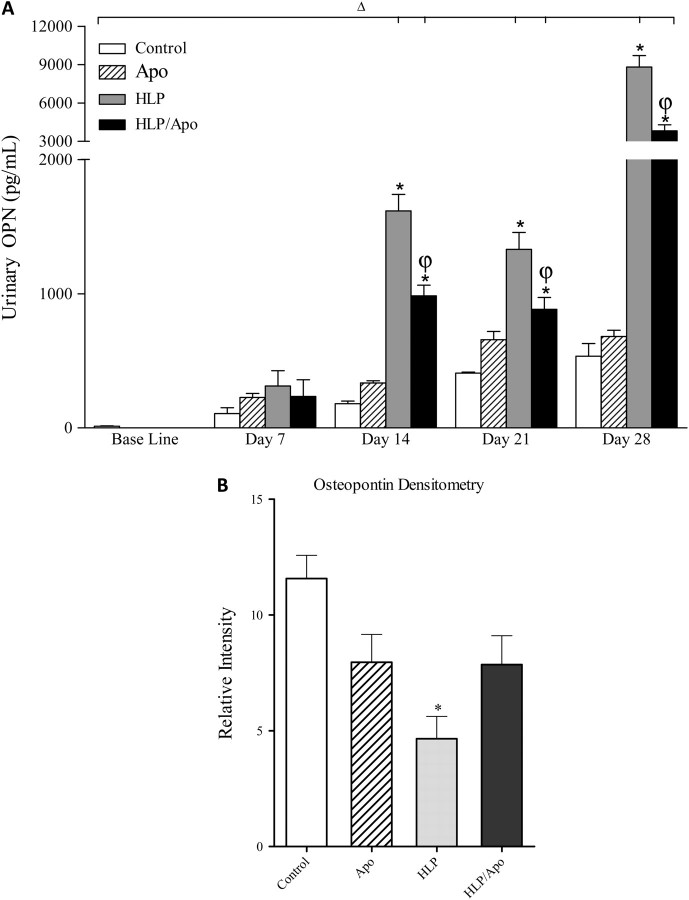
Fig. 4.
Changes in OPN. (A) Urinary excretion of OPN was significantly increased by on Days 14, 21 and 28 compared to controls and was significantly reduced by apocynin treatment on 14, 21 and 28 days of the experiment. ΔP < 0.05 baseline versus HLP and Apoc/HLP on different days. *P < 0.05 control versus HLP and HLP/Apoc within the time period. φP < 0.05 HLP versus HLP/Apoc within the time period. (B) Renal expression of OPN-1 as determined by densitometric analysis of the immunoblots. Kidneys of HLP-treated rats had significantly less amounts of OPN. Apocynin treatment had no significant effect on OPN production. *P < 0.05 HLP versus control, Apoc and HLP/Apoc.

