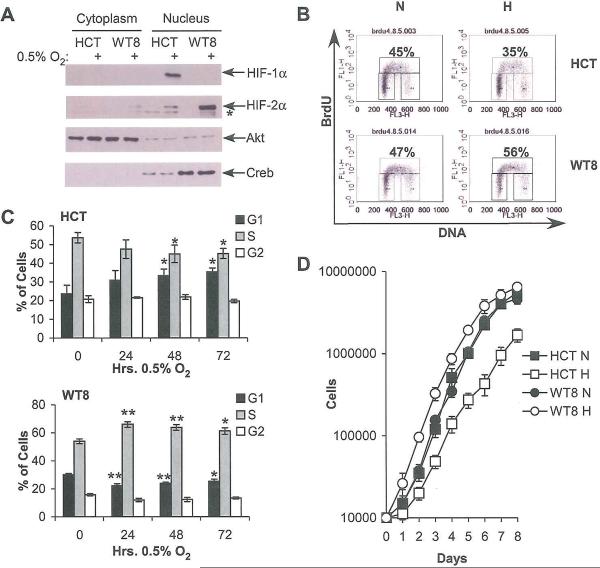
Figure 1.
Differential expression of HIF-1α and HIF-2α in HCT116 and WT8 cells correlates with differential cell cycle progression under hypoxia. A. Western blot of HIF-α expression in HCT116 (“FICT”) and WT8 cells following 4 hrs. incubation at 0.5% O2 shows differential expression of HIF-α subunits. Asterisk denotes a background band. Akt and Creb immunoblots assess loading and the efficiency of cellular fractionation; Akt is present in both the nucleus and cytoplasm, while Creb is exclusively nuclear. B. Representative BrdU incorporation plots from HCT116 and WT8 cells grown at 21% or 0.5% O2 for 48 hrs. C. Summary of changes in BrdU incorporation in HCT116 and WT8 cells after 24, 48 and 72 hrs. hypoxia. Results averaged from 3 experiments, error bars ±1 SEM, * p < 0.05, ** p < 0.01. D. Proliferation measured by serial cell counts under normoxia (N) or hypoxia (H); data from one representative experiment. Error ±1 SD.

