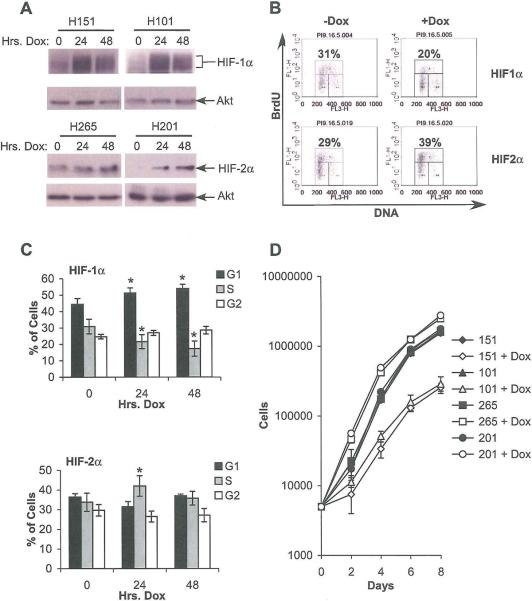
Figure 7.
Doxycycline-regulated NIH3T3 cells expressing normoxically stable HIF-1α or HIF-2α show differential effects on cell cycle progression. A. Western blots showing HIF-α subunit expression following 24 or 48 hrs. treatment with doxycycline. B. Representative FACS plot at 0 and 2 days doxycycline from a HIF-1α (151) and HIF-2α (201) expressing clone. C. Cell cycle progression in doxycycline-regulated 3T3s (clones 151 and 201) measured by BrdU incorporation. Results from 3 experiments are shown, error bars ±1 SEM, * p < 0.05. D. Proliferation measured by serial cell counts; data from one representative experiment. Error ±1 SD.

