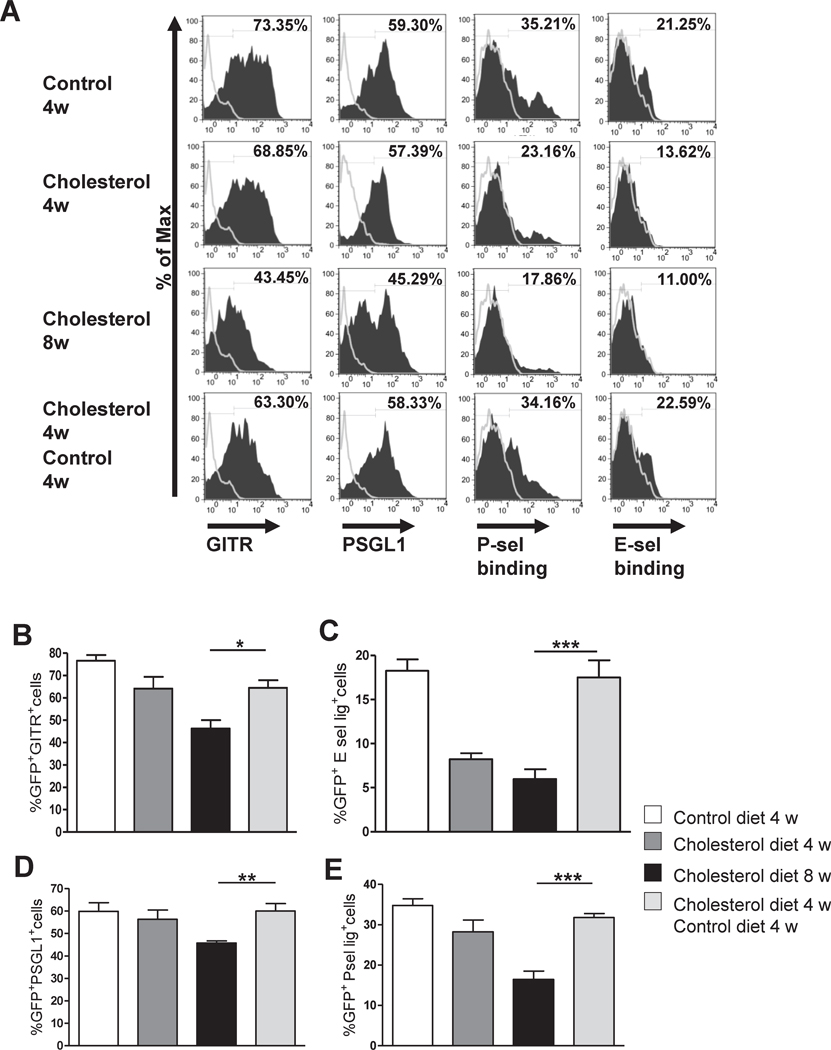
Figure 6. Changes in diet prevent reduction in the functional phenotype of Treg.
Spleen cells from mice in the diet reversal study described in Figure 5A–E were stained for CD4, GITR, PSGL1, and P-selectin and E-selectin IgG chimeras, and analyzed by flow cytometry gating on CD4+GFP+ population. A, Histograms correspond to one representative mouse. B–E, FACS analysis data represent mean +/− S.E.M, N= 5–9 mice per group. * P <0.05, ** P<0.01, *** P< 0.001, analyzed by one way ANOVA with Tukey’s post test.

