
Figure 3.
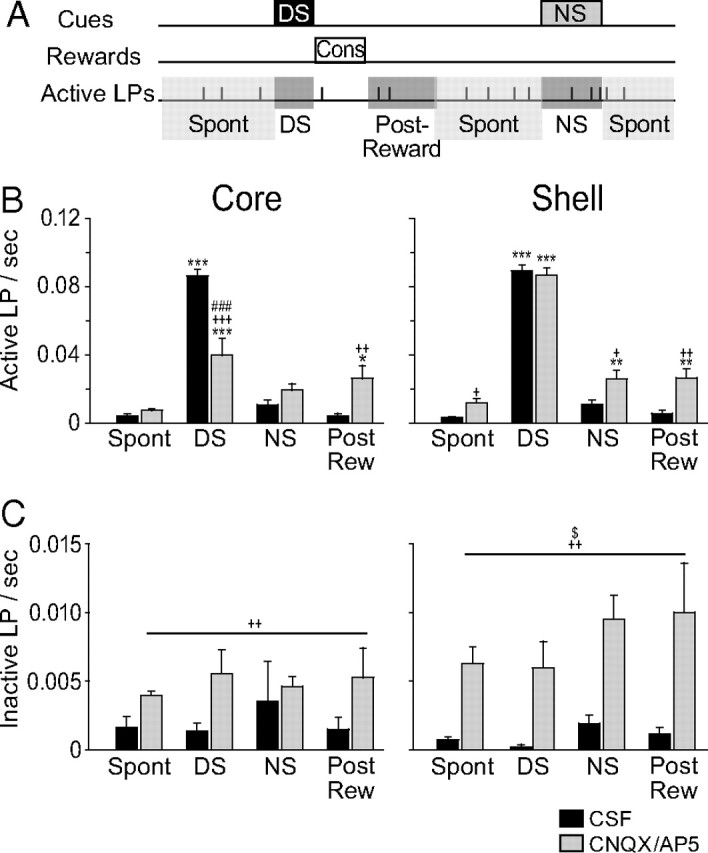
Time window analysis of lever pressing after pharmacological inactivation of the NAc core and shell. A, Schematic illustrating the time windows in which the frequency of lever pressing was analyzed. DS and NS windows correspond to the entire duration of the cues. The postreward window corresponds to the 10 s following the consumption of the reward. The spontaneous window (spon) corresponds to the remaining time. B, C, Frequency of active (B) and inactive (C) lever pressing in the different time windows after CSF or CNQX/AP5 injections in the core (left) or the shell (right). *p < 0.05, **p < 0.01, ***p < 0.001 compared to the spontaneous window; +p < 0.05, ++p < 0.01, +++p < 0.001 compared to CSF injections and #p < 0.05, ##p < 0.01, ###p < 0.001 compared to shell injections, $p < 0.05 structure × injection effect.