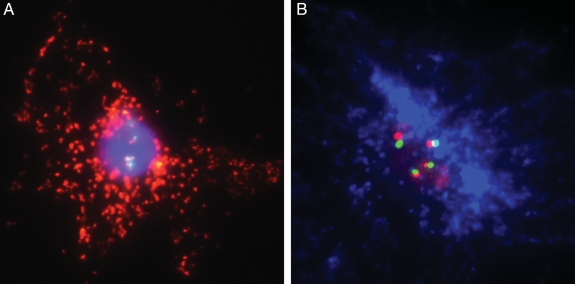
Fig. 2.
FIGPA in fixed human tumor cells. (A) FIGPA in U87 glioblastoma cells transfected with EGFRvIII. Proximate green (Spectrum Green) and red (Spectrum Orange) signals represent the centromere of chromosome 7 and the EGFR gene locus, respectively; the cytoplasmic red dots (563-nm dye) visualize the EGFRvIII protein. The nucleus is counterstained with Hoechst 33342. (B) Use of Pacific Blue protein detection dye (455 nm) in place of red 563-nm dye. All magnifications ×400.

