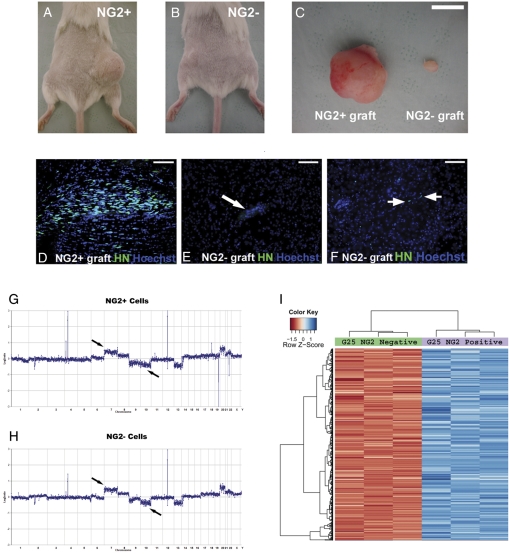
Fig. 4.
Glioblastoma multiforme (GBM) neuroglia (NG)-2+ cells exhibit higher tumorigenic capability compared with the GBM NG2− cells. (A) Subcutaneous mass developed in the right hindlimb after the implantation of GBM NG2+ cells. (B) Small subcutaneous mass developed in the left hindlimb after the implantation of the GBM NG2− cells. (C) Subcutaneous tumors excised from A and B. (D) Intracerebral tumor masses can be observed in mice after orthotopic implantation of the GBM NG2+ cells as shown by human nuclei staining. (E) Orthotopic implantations of the GBM NG2− cells do not form tumors. (F) Occasionally isolated HN+ cells can be observed in brains of animals implanted with the GBM NG2− cells. (G) Comparative genomic hybridization (CGH) of the GBM NG2+ cells. (H) CGH of the GBM NG2− cells. In G and H, black arrows indicate gain of chromosome 7 and loss of chromosome 10 (black arrows), which are typical cytogenetic abnormalities in GBM. Green arrows show abnormalities that are more pronounced in the GBM NG2+ cells, whereas red arrows indicate abnormalities that only exist in the GBM NG2+ cells. (I) Example of a heat map of genes differentially expressed by the GBM-NG2+ and GBM-NG2− cells. Scale bars: 100 µm in D, E, and F; 10 mm in C.

