Figure 3.
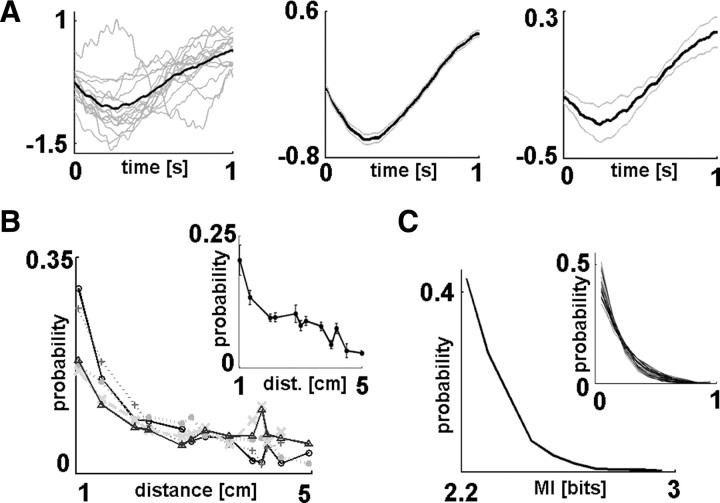
SWA propagation characteristics. A, Average waveforms of data segments with significant nonlinear correlations across ECoG channels. Left, Mean waveform from all ECoG channels separately (gray) and averaged (black) from a representative sleep segment of a single subject. Only data segments that showed significant correlations with other recording channels were included in these calculations. Middle, Mean waveform of significantly correlated data segments from the same subject including all analyzed sleep segments (black). Gray lines show SEM. Right, Grand average from all patients (black, mean; gray, SEM across patients). It should be noted that ECoG segments were standardized before the calculation of waveform averages; thus, tick labels of the y-axis show standardized voltage values. Average waveforms of data segments with significant waveform correlations across channels showed characteristic down-to-up state transitions, including the rising phase of SWA. B, Propagation distance distributions of unitary propagation events (Fig. 1C, length distribution of single arrows). Propagation distance distributions from the five analyzed sleep segments of a representative subject. Inset, Average distribution from all subjects. Error bars indicate SEM. SWA propagation to adjacent locations were significantly more frequent than spread to more distant loci (p = 7.12 × 10⁻²¹, Mann–Whitney U test); however, spatial noncontinuities of SWA propagation between areas located 5 cm away (largest distance covered) could also be detected. C, Distribution of association strength (Fig. 1C, maximal MI values of unitary propagation events indicated by the colors of the arrows). MI distribution from a representative sleep segment is shown. Inset, Connection strength distributions overlaid for all analyzed recording segments of all subjects. Because the range of connection strength values could vary, MI values were normalized between 0 and 1 for this plot. The shape of the distribution was similar across sleep segments and subjects.

