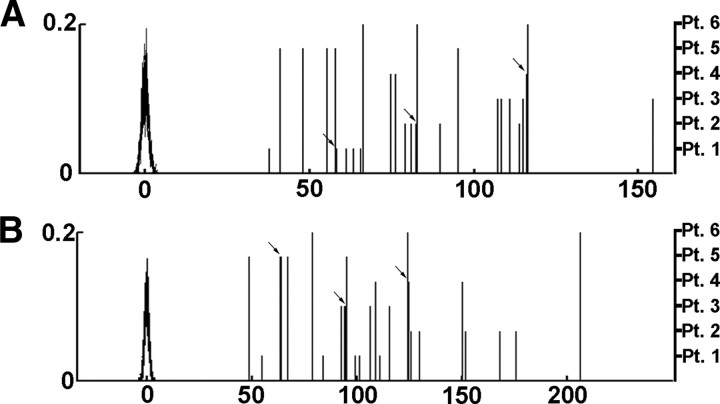
Figure 6.
Reciprocal connections and short circles in the course of SWA propagation. A, Normalized number of reciprocal connections calculated for all analyzed sleep segments in all subjects. Normalization was performed using control distributions (see Materials and Methods). Normalized control distributions are superimposed in black (left y-axis shows probabilities). Normalized numbers of reciprocal propagations are indicated as vertical bars (different lengths correspond to different patients; right y-axis). The number of reciprocal connections was found to be highly above control values in all cases (p ≈ 0). Arrows point to overlapping values. B, Normalized number of three-point circles displayed in a similar way as reciprocal connections. The number of circles was significantly above control values (p ≈ 0).

