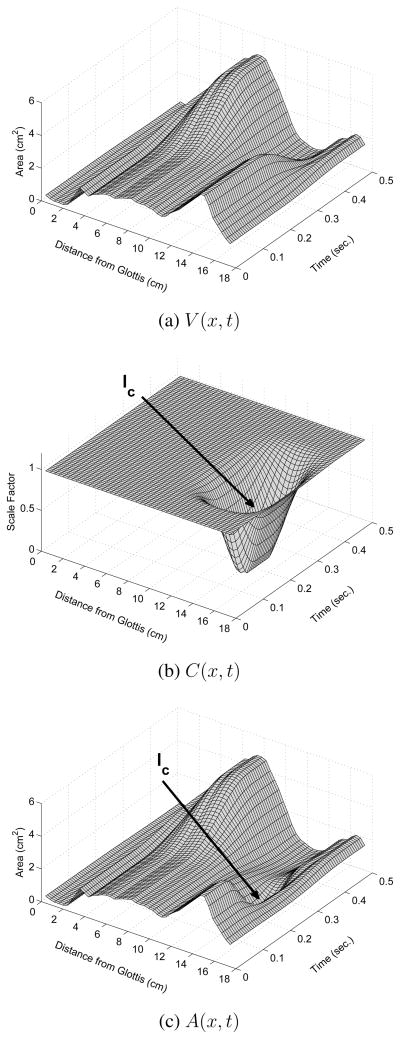
Figure 3.
Graphical illustration of generating a 3D time-varying area function for a VCV with Eqns. 1–2. In each plot, distance from the glottis is represented on the leftmost diagonal axis, time is on the rightmost diagonal axis, and area is on the vertical axis. (a) Time-varying mode coefficients q1(t) and q2(t) that produce an approximate [ɑi] transition, (b) time-dependent consonant perturbation function based on the functions in Figs. 1c and 2; the arrow points to the constriction location, and (c) composite area function resulting from the element-by-element and sample-by-sample product of the functions in (a) and (b).

