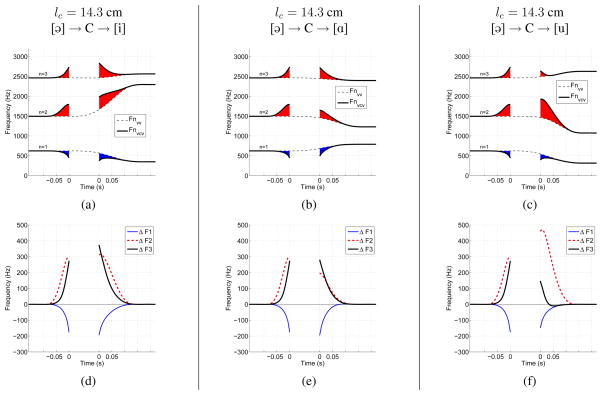
Figure 4.
Formant frequencies and formant deflections calculated for time-varying area functions of VVs and VCVs, like those in Figs. 3a and 3c. For the plots in the top row (a,b,c), dashed lines indicate the calculated formants for each VV transition only, while the thick solid lines are the formants for the VCV. The shaded portions indicate the deflection of the formant frequencies generated by the VCV away from those generated by the VV alone (red indicates an upward deflection and blue a downward deflection). The plots in the bottom row (d,e,f) show time-dependent differences (deflections) between the formant frequencies generated by the VCV relative to those generated by the VV alone, based on Eqn. 3. Negative and positive time on the x-axis of each plot denotes the constriction onset and offset periods, respectively. The time between the two “zero” points is the period of vocal tract occlusion. Each column of plots corresponds to a VV context of [ɑi], [ɑ ə], or [ɑu], and the constriction location is lc = 14.3 cm for all three cases.

