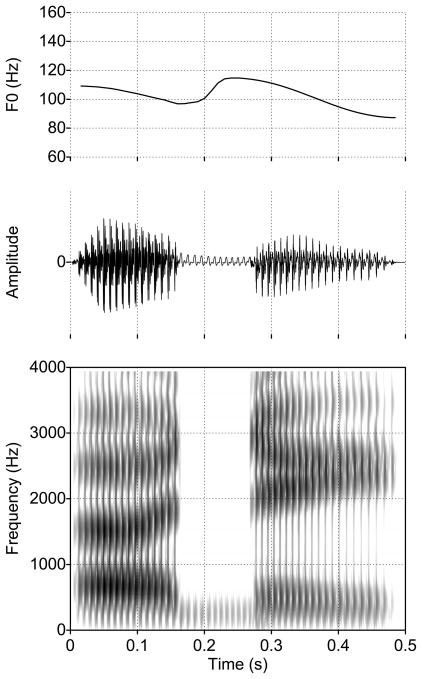
Figure 6.
Example of the fundamental frequency (F0) contour, waveform, and spectrogram of a synthetic speech sample produced in the [ɑCi] environment with lc = 14.3 cm. The top panel shows the F0 contour, the middle panel is the speech signal, and the bottom panel is the wide-band spectrogram of the the speech signal. Waveforms such as this were converted to an audio file for presentation in the listening experiment.

