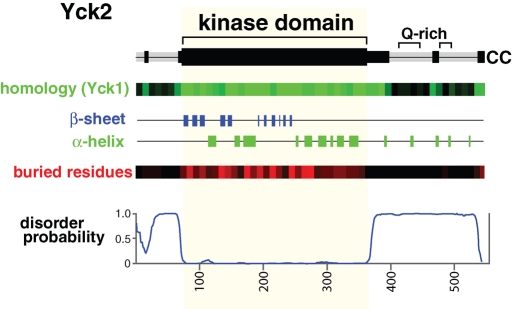
FIGURE 1:
Yck2 structural predictions. Top, a Yck2 protein schematic indicating regions of Yck2/Yck1 sequence conservation (black segments) as well as the two glutamine-rich sequences (Q-rich). Bottom, the output of various sequence analysis tools. The entry labeled “homology (Yck1)” shows a representation of Basic Local Alignment Search Tool (BLAST) results between Saccharomyces cerevisiae Yck2 and Yck1, with the number of Yck2-Yck1 identities within each 10-residue-long sequence interval reported in graded shades of green (a fully conserved segment with 10 identities is true green, and a segment with no identities is black). To exclude the contribution of the low complexity, glutamine-rich CTD sequences, glutamine identities over the Yck2 C-terminal 150 residues were not included. β-sheet and α-helical secondary structures, as well as “buried residues,” were predicted by NetSurfP (Petersen et al., 2009). For “buried residues,” the probability that the individual Yck2 residues were likely to be buried within the folded protein or exposed to solvent at the protein surface were predicted. The number of buried residues predicted per each 10-residue segment are reported as graded shades of red (a fully buried 10-residue-long segment would be true red, and a fully exposed segment would be black). At the bottom is shown for Yck2 output from DISOPRED2 (Ward et al., 2004) an algorithm that predicts intrinsically disordered protein domains (sequences that are most strongly predicted to be disordered receive a value of 1.0).

