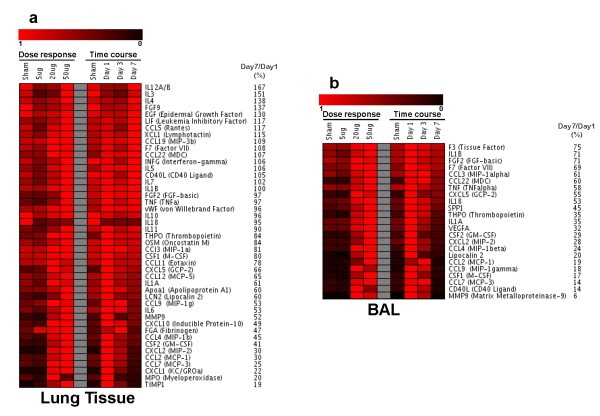
Figure 3.
Heatmap representation of protein concentration levels in lung homogenate and bronchoalveolar lavage (BAL) following intratracheal instillation of carbon nanoparticles in JF1/Msf mice. Shown are normalized data (highest value is set to "1") for dose or time response. Red color indicates increasing concentrations. Protein symbols and relative expression day7/day1 (in %) are indicated.

