Figure 1.

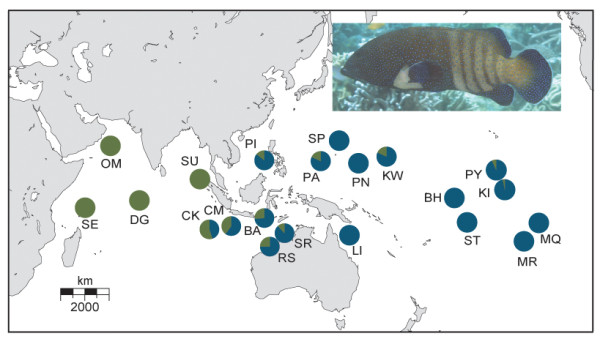
Map of study area. Pie charts represent the ratio of individuals at each location with either the Pacific or Indian Ocean lineage as defined in Figure 2 (Photo credit: Luiz Rocha).

Map of study area. Pie charts represent the ratio of individuals at each location with either the Pacific or Indian Ocean lineage as defined in Figure 2 (Photo credit: Luiz Rocha).