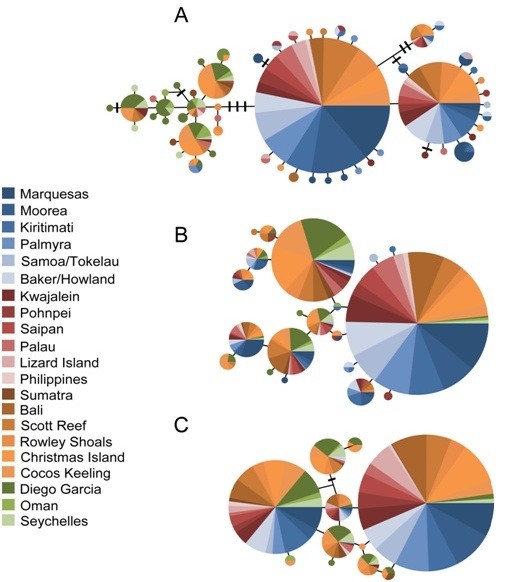
Figure 2.

Median-joining networks for Cephalopholis argus. Networks were constructed using the program NETWORK 4.5 [43] for (a) 550 cytochrome b sequences (b) alleles at GnRH intron from 488 individuals, and (c) alleles at S7 intron for 490 individuals. Each circle represents one mitochondrial haplotype or nuclear allele with the area of each circle proportional to the number of that particular haplotype or allele in the dataset; dashes represent hypothetical haplotypes or alleles; colors represent collection location (see key).
