
Figure 7.
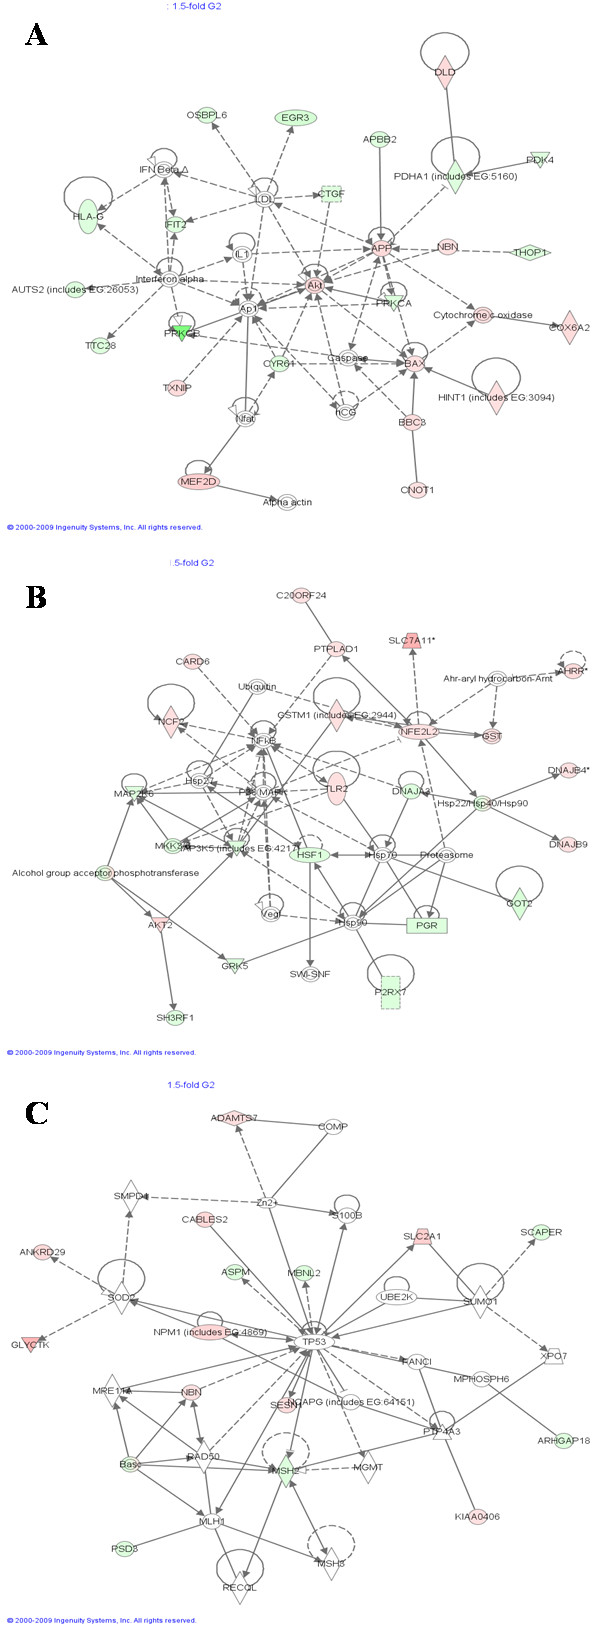
Ingenuity Pathway Analysis (IPA) on genes modulated by BaP in G2/M-enriched MCF-7 cell cultures. Gene lists of 1.5-fold differentially expressed genes in different phases were imported to IPA software, which revealed the involvement of several pathways and genes in the response to BaP. Three networks are shown here. Red colour denotes up-regulation and green colour denotes down-regulation. The IPA legend is shown in Additional file 6.