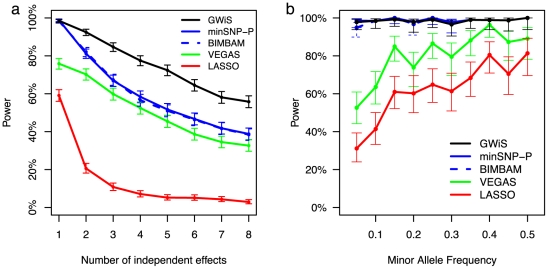
Figure 1. Estimated power at genome-wide significance for simulated data.
Power estimates for GWiS (black), minSNP-P (blue), BIMBAM (dashed blue), VEGAS (green), and LASSO (red) are shown for 0.007 population variance explained by a gene. Genes were selected at random from Chr 1; genotypes were taken from ARIC; and phenotypes were simulated according to known models with up to 8 causal variants with independent effects. (a) Power decreases as total variance is diluted over an increasing number of causal variants. (b) Power estimates with 95% confidence intervals are shown as a function of minor allele frequency (MAF) for the simulations from panel (a) with a single independent effect. GWiS, minSNP, minSNP-P, and BIMBAM are robust to low minor allele frequency, whereas VEGAS and LASSO lose power.

