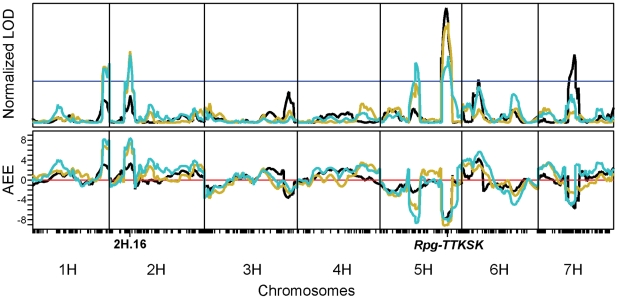
Figure 2. Field evaluation of the QSM population in Njoro, Kenya, identifies two quantitative trait loci on chromosomes 2H and 5H that contribute significantly to resistance.
Upper panel, the LOD curves from composite interval mapping of the Pgt race TTKSK infection coefficients [product of percent severity and lesion size (scale of 0.25–1.0)] in the 2008 growing season. Black, gold, and cyan correspond to the 7 Oct 2008, 17 Oct 2008, and 7 Nov 2008 phenotype collection dates, respectively. LOD curves were normalized to their respective experiment-wise thresholds, shown as the horizontal blue line. Lower panel, the AEE for the additive effect estimate of the infection severity, with the red line denoting zero. Negative values indicate that resistance is contributed by the Q21861 allele, and positive values indicate that resistance is contributed by the SM89010 allele.

