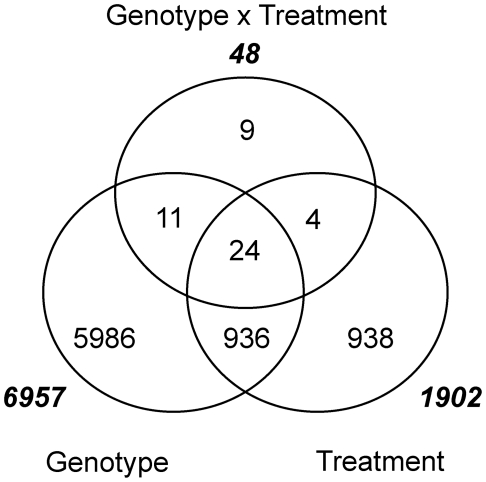
Figure 3. Genes differentially expressed using parents Q21861 and SM89010 for genotype, treatment (INOC versus MOCK), and their interaction.
A two-way ANOVA using genotype (Q21861 and SM89010) and treatment (INOC and MOCK) was performed using the natural log normalized expression data to determine the number of differentially expressed genes between genotypes, treatments, and their interaction. False discovery rate was controlled at 5%. Totals for each class of interaction are displayed in bold italics.

