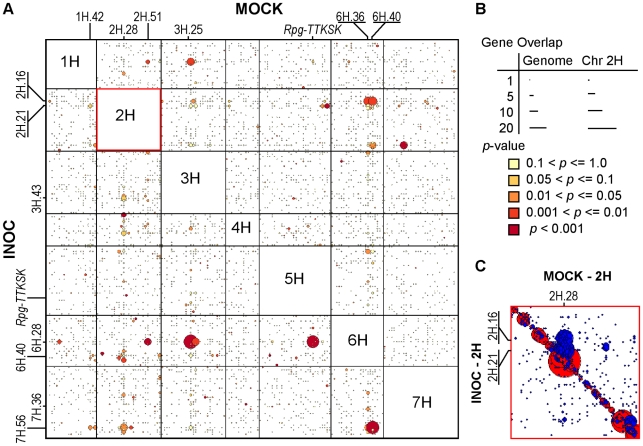
Figure 6. Genes from 2H.28/29, 3H.27, 6H.36/38, and 6H.40 loci are regulated by the 2H.16 trans-eQTL hotspot after challenge by Pgt race TTKSK.
(A) Genes with eQTL on different chromosomes in INOC and MOCK experiments are included in the larger panel (5,538 genes), where the genetic positions of the most significant eQTL (based on LOD score) for each experiment is shown (see legend in panel B). The horizontal and vertical axes correspond to INOC and MOCK, respectively, and where each position in the plot is a superbin. (B) Gene overlap is visualized based on the diameters of circles, showing the number of genes regulated for a given region between the two experiments (smallest to largest representing 1 to 16 genes). Bootstrap-determined p-values are represented with colors based on the significance of the number of genes overlapping between INOC and MOCK under a random distribution, excluding eQTL that reside on the same chromosome. (C) Individual bin position of the most significant eQTL in INOC and MOCK on chromosome 2H, where a significant distortion from the cis-diagonal implicates altered regulation between the MOCK 2H.28/29 locus and INOC 2H.16/17/18 and 2H.21/22 loci. Filled red circles with diameter corresponding to the number of genes with the peak of their maximum eQTL shared between INOC and MOCK. If a position is off-diagonal, it is a filled blue circle with similar correspondence to the number of genes.

