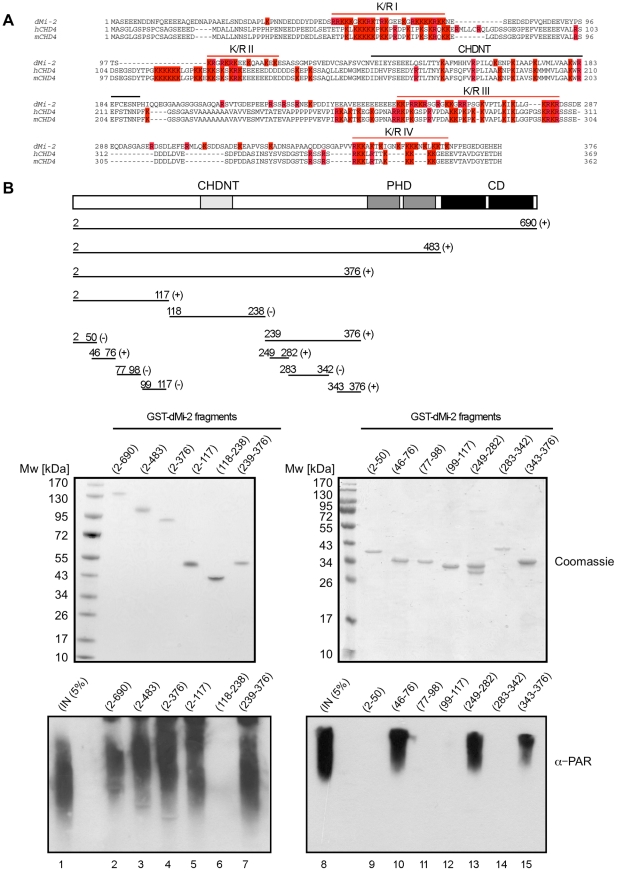
Figure 4. PAR–binding regions of dMi-2.
(A) Multiple sequence alignment of N-terminus of dMi-2 and human and mouse CHD4. All K and R amino acid residues are coloured in red. Red lines indicate the four K/R rich regions. The black line indicates the CHDNT domain. (B) Mapping of PAR binding regions in the N-terminal part of dMi-2. Upper panel: Schematic representation of dMi-2 constructs used. Numbers indicate the amino acid borders of the constructs. (+) and (-) indicate binding to PAR. Middle panel: Coomasie stained gels with purified GST-dMi-2 fragments used for PARP pulldown assays. Lower panel: PAR binding assays with GST-dMi-2 fragments were performed as in Figure 3B. Bound material was analysed by anti-PAR Western blot. Lanes 1 and 8: inputs.

