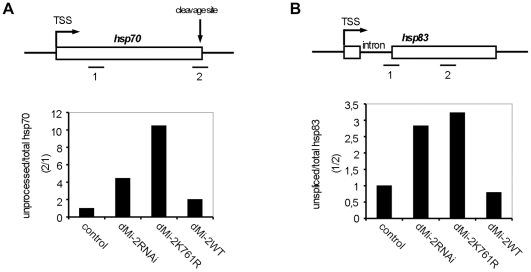
Figure 7. dMi-2 is required for efficient RNA processing.
(A and B) Upper panels: Schematic representations of the hsp70 and hsp83 genes. RT-QPCR amplimers, hsp70 cleavage site, hsp83 intron and transcriptional start sites (TSS) are shown. (A) Lower panel: RT-QPCR from control and transgenic larvae. The ratio between 3′ unprocessed and total hsp70 RNA was determined (hsp70: amplimer 2/amplimer 1). The ratio obtained for control larvae was set to 1, other ratios were expressed relative to this. (B) Lower panel: The ratio between unspliced and total hsp83 RNA was determined (hsp83: amplimer 1/amplimer 2) and plotted as in (A).

