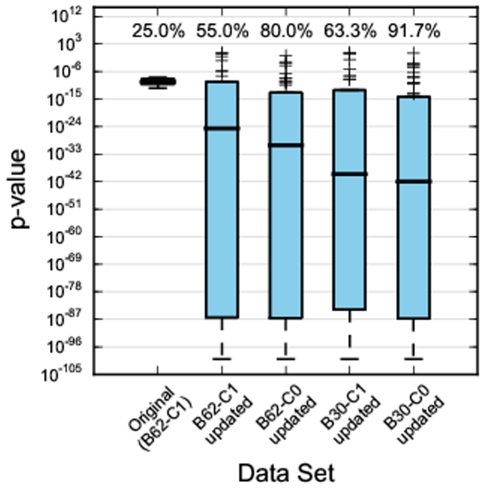
Figure 4. Effect of various BLOSUM matrix and cut-off values on Predikin's performance.
Each boxplot shows the distribution of p-values obtained from the set of 61 yeast protein kinase from [17]. The left-most, original, plot shows scores obtain with the version of Predikin that were used for the DREAM4 predictions. The next plot shows the distribution when the new method of DREAM4 position weight matrix is applied to the original database, and the following plots show the distributions obtained with the updated database (including PhosphoELM data) using different Predikin options. B62/B30 indicates BLOSUM62 and BLOSUM30 as substitution matrices, respectively, and C1/C0 indicates a BLOSUM cut-off score of 1 or 0, respectively. The numbers above each boxplot show the coverage of each distribution, that is the percentage of the kinases that Predikin was able to make predictions for. The median p-value clearly decreases moving from left to right indicating a general improvement in prediction accuracy. But strikingly, there is a dramatic improvement in coverage – the original algorithm only had a coverage of 25% whereas the right-most distribution (using BLOSUM30 and a cut-off of 0) has a coverage of over 90%.

