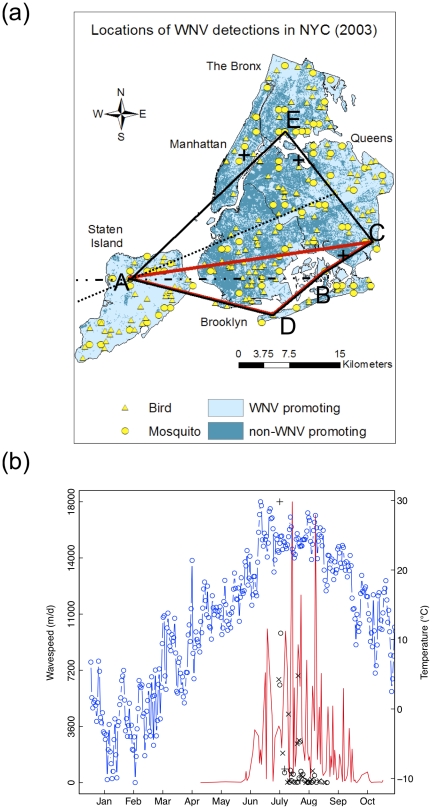
Figure 1. The spatial structure of annual WNV outbreaks in NYC, demonstrated for the year of 2003.
(a) Speed of WNV spread was estimated from point locations of WNV-positive mosquito pools (circles) and WNV-positive dead birds (triangles). Dark and light cyan areas represent transmission-inhibiting and transmission-promoting land-cover types. The black crosses represent the approximate location of Central Park, La Guardia Airport and the John F. Kennedy International Airport respectively, where NOAA collects weather data. The first five locations where WNV was detected in 2003 are labelled as A,B,C,D and E, respectively. The first estimate of wave-speed was calculated using the convex hull method as (1) the increase of the square root area of the polygon encompassing ABCDE (black) relative to the square root area of the polygon encompassing ABCD (red) locations (convex hull method); (2) the difference between the average length of the two transects from A (ultrafine dashed and dash-dotted) intersecting the polygon ABCDE and the length of the transect (dash-dotted) intersecting the polygon ABCD (boundary displacement method); (3) the increase of the maximum distance between AC and AB (maximum distance method), divided by the time elapsed. Further evolution of the infected area can be seen on Fig. S1 in Text S1. (b) Estimated speed of WNV spread (black, in meters d−1), based on the convex hull method (circles), the boundary displacement method (symbol X ) and the maximum distance method (crosses), respectively; mean daily temperature (blue), and the total daily number of mosquitoes collected (red) over time.

