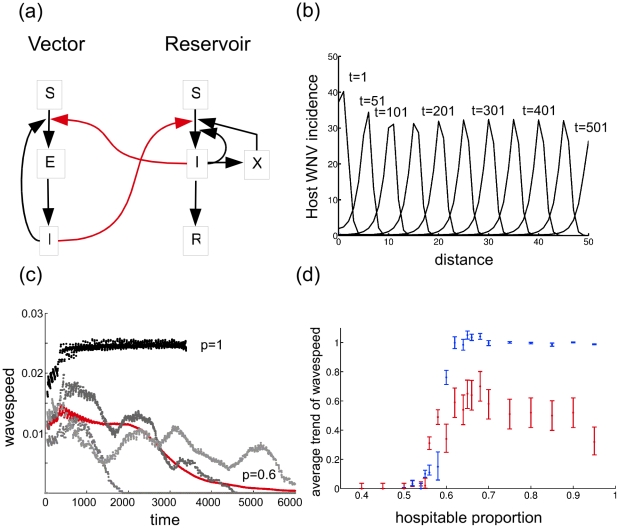
Figure 2. Transition from homogeneity to percolating phenomena in heterogeneous environments.
(a) Compartmental model for local WNV transmission. Red and black arrows represent transmission routes incorporated into simplified and full models, respectively. The variable X represents dead birds that could be the source of infection to humans in a full model. (b) Travelling waves in the number of infectious hosts in homogeneous case (p = 1) from the origin along a tangent. (c) Time-dependent estimates of wave speed of the pathogen at p = 1 (black line) and at p = 0.6 (grey and red lines show individual runs and average, respectively). (d) Average trend of wave-speed (blue) and number of realizations where this trend is above 1 (red). Error bars show SE and 95% C.I. for the average trend and for the number of realizations, respectively.

