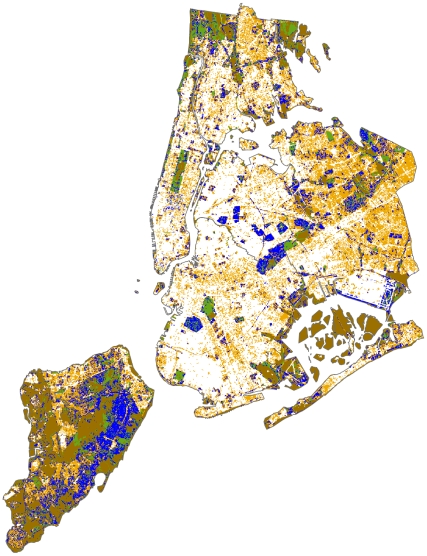
Figure 5. Distribution of land-cover types in NYC.
White represents the unfavourable developed high-intensity land cover type. Orange, blue and green areas represent developed medium-intensity, developed low intensity, and developed open-space land cover types, respectively, while brown represent all other land-cover types. Non-white (hospitable) areas cover 59.93% of NYC.

