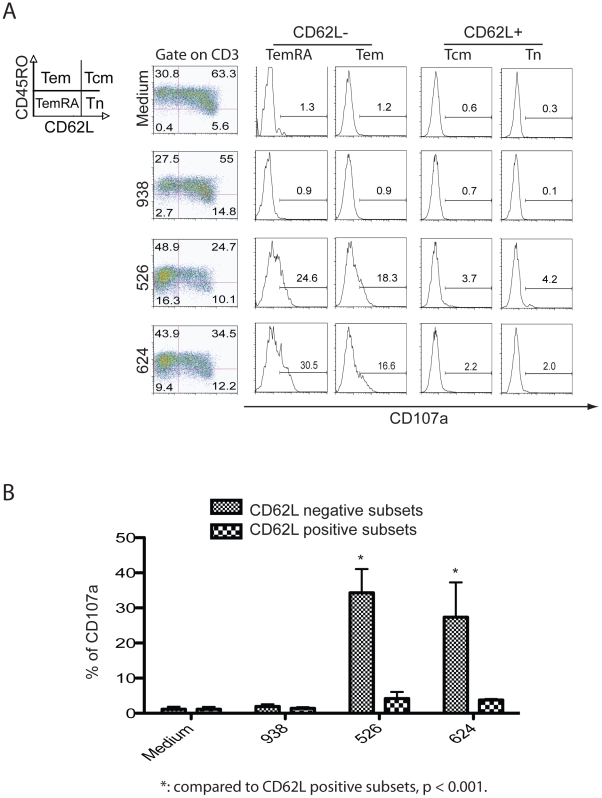
Figure 1. The loss of CD62L is specific and correlates with CD107a surface expression.
A. MART-1 TCR vector-transduced T cells were co-cultured with melanoma lines 526, 624 (both HLA-A*0201 positive) and 938 (HLA-A*0201 negative) for four hours and then analyzed by FACS. The first column on left, the cells were plotted using differentiation markers CD45RO and CD62L into 4 subsets, the expression of CD107a on each subset was denoted in the histograms to the right. B. Based on data from three independent experiments, the expression of CD107a after co-culture with melanoma lines was determined and mean% ± stdev plotted. Student t-test was used for statistical analysis. The fluorophore conjugated antibodies used in this analysis were CD107a FITC, CD62L PE, CD45RO APC, CD3 APC-Cy7 with propidium iodide staining.

