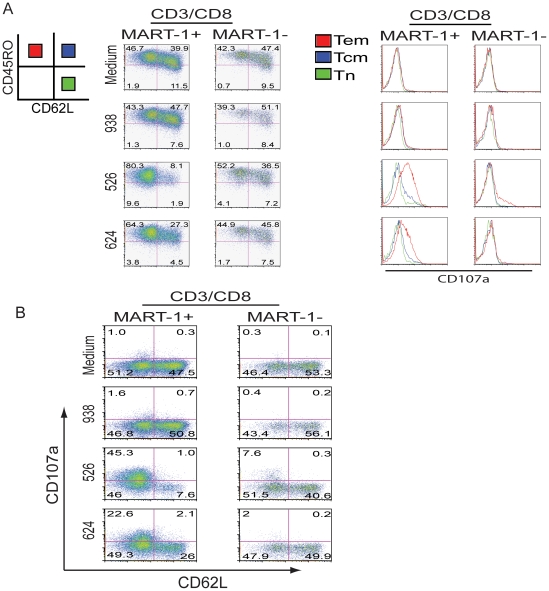
Figure 2. The loss of CD62L is tumor antigen specific and the expression of CD107a occurs on CD62L negative cells.
A. TCR transduced cells were cultured as described in methods. Shown is the FACS analysis, where cells were gated on CD3/CD8/MART-1+ or CD3/CD8/MART-1−, and then plotted using markers CD45RO and CD62L (left two column plots). The expression of CD107a on each group was then determined and separately plotted in the histograms on right corresponding to column data on left. In each histogram the expression of CD107a on each subset was overlaid reflecting Tem, Tcm and naïve populations. Red (CD45RO+CD62L−) indicates Tem, blue (CD45RO+CD62L+) indicates Tcm, and green (CD45RO−CD62L+) indicates Tn population. B. The cells were processed as described above. By FACS analysis, the cells were gated on CD3/CD8/MART-1+ or CD3/CD8/MART-1−, then plotted using markers CD107a and CD62L in dot plots. The fluorophore conjugated antibodies used in this analysis were CD107a FITC, CD62L PE, CD45RO APC, CD3 APC-Cy7 with propidium iodide staining.

