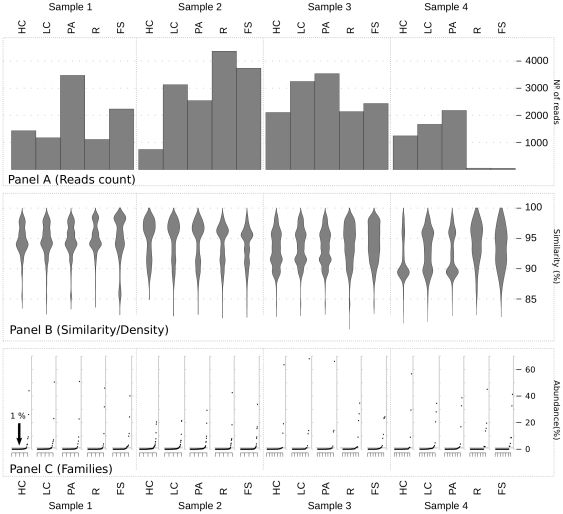
Figure 1. Sequencing overview.
The image shows a general overview of the sequencing results. Abbreviations are defined as follow. Active fractions: PA, pyronin-Y activated; LC, low Cy5; HC, high Cy5. Total fractions: FS, Fecal Suspension; R, Ring fraction (see Methods section). Panel A reports the number of reads obtained from each sample/fraction. Panel B shows “violin plots” reporting on the X-axis the density of sequences at a given percentage of similarity (Y-axis) of the best matches from the database (see Methods section). Panel C reports the ordered percentage distribution of families for each sample/fraction; the gray dotted line labeled as “ ” defines the threshold used to define the two categories of URB and ORB.

