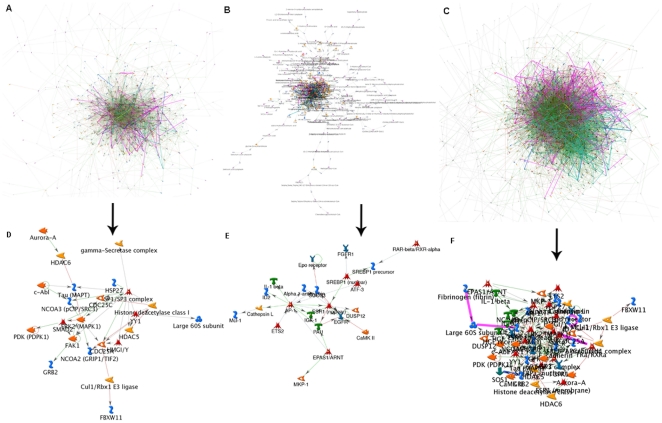
Figure 2.
Network for upregulated genes (A), downregulated genes (B) and all differentially expressed genes (C). Hub-based network view of 10 upregulated hub genes (D), 7 downregulated hub genes (E) and 27 differentially expressed hub genes (F). GeneGO MetaCore was used to generate a network of direct connections among genes selected for analysis. Red, green, and gray arrows indicate negative, positive, and unspecified effects, respectively. Hubs were identified as having more than thirty connections and less than 50% of edges hidden within the network.

