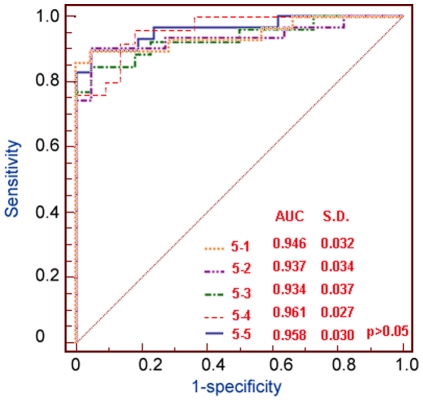
Figure 3. ROC curves for 5-fold cross-validations against the golden standard datasets.
Each point on the ROC curve denotes the sensitivity and specificity against a set of weights and score threshold. Different colors are used to distinguish the curves of classifier in cross-validations for five times. AUC values are also presented in the figure. Sensitivity and specificity are computed during the 5-fold cross-validations (see text for details).

