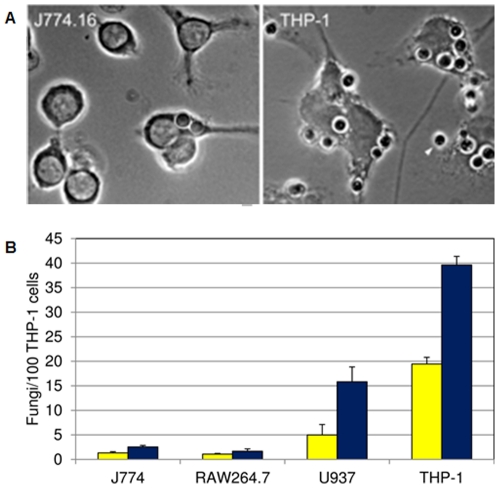
Figure 3. Host lines differ in phagocytosis of C. neoformans.
Panel A, bright-field microscopy of J774.16 and THP-1 cells challenged with fungi. All fungal cells shown were internalized except one (yellow arrowhead). Scale bar, 5 µm. Panel B, adherence (yellow bars) and uptake (blue bars) values for the indicated macrophage-like cell lines. Mean and standard deviation values are shown.

