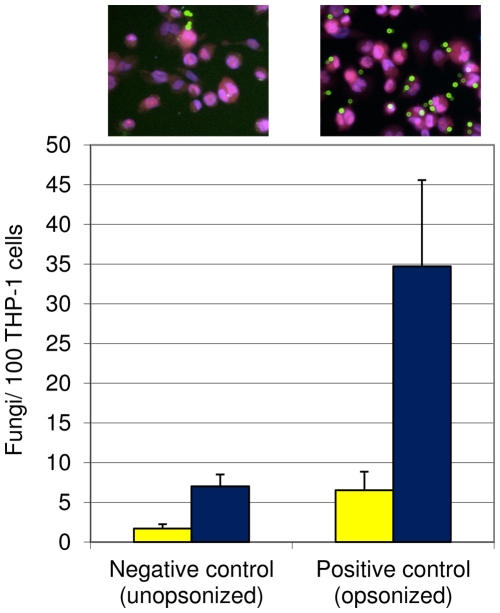
Figure 7. Positive and negative controls used for statistical analysis of assay power.
Standard assays were performed using the controls shown above. Mean and standard deviation are plotted for adherence (yellow bars) and uptake (blue bars). Representative images for each control are shown above the bars. Scale bar, 5 µm.

