
Figure 1. Distribution of proximal femur T-scores.
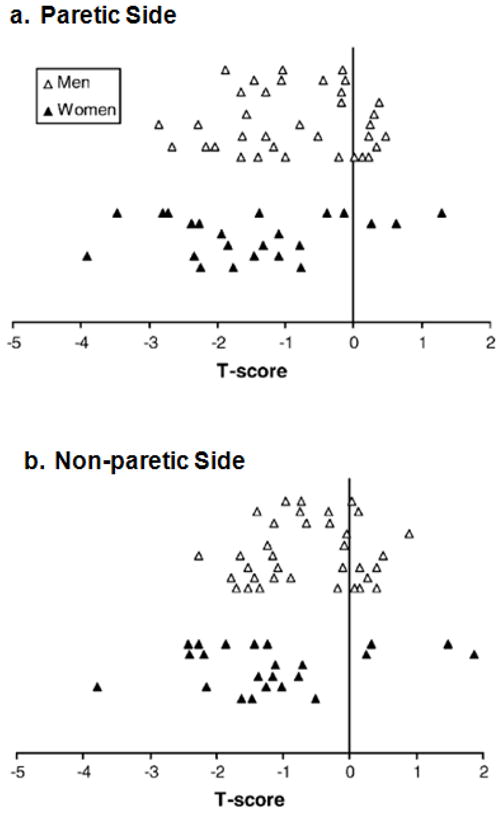
Proximal femur T-scores for the (a) Paretic Side and (b) the Non-paretic Side were indicated by open triangles (men), and solid triangles (women). Each triangle represents a single subject.
Official websites use .gov
A
.gov website belongs to an official
government organization in the United States.
Secure .gov websites use HTTPS
A lock (
) or https:// means you've safely
connected to the .gov website. Share sensitive
information only on official, secure websites.
Proximal femur T-scores for the (a) Paretic Side and (b) the Non-paretic Side were indicated by open triangles (men), and solid triangles (women). Each triangle represents a single subject.