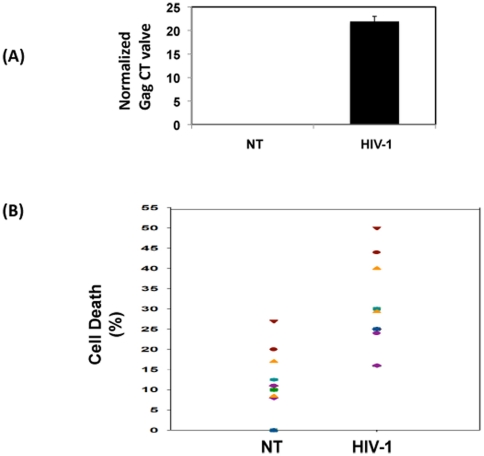
Figure 1. Infectivity in and cell death in PBMCs used for analyses.
(A) Normal donor PBMCs were infected with HIV-1 or mock infected for seven days. RNA was isolated and tested for Gag by RT-PCR. Gag CT values were obtained by using the endogenous control for normalization. Figure shows average CT value from 16 independent donors. (B) After seven days, post-infection cell death was assessed by trypan blue dye exclusion method. Dot blot represents percentage of cell death in uninfected (NT) and infected (HIV-1) PBMCs from 16 independent donors.

