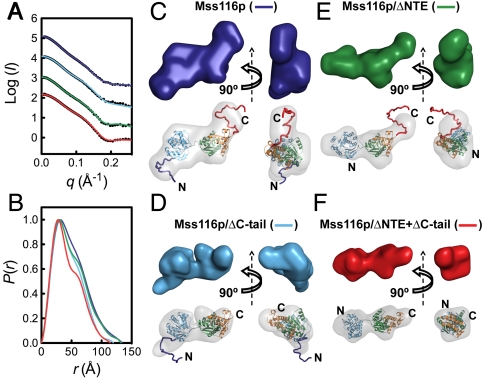
Fig. 2.
SAXS analysis of Mss116p in the open state without substrates. SAXS data are shown for full-length Mss116p (dark blue), Mss116p/ΔC-tail (light blue), Mss116p/ΔNTE (green), and Mss116p/ΔNTE + ΔC-tail (red). (A) Scattering profiles, which are displaced along the logarithmic axis for visualization, are shown as the logarithm of the scattering intensity, I (black dots), as a function of the momentum transfer, q = 4π sin(θ)/λ, where 2θ is the scattering angle and λ is the X-ray wavelength. The solid curves overlaying the SAXS data are the expected scattering profiles of the corresponding BUNCH models (see below). (B) Normalized distance distribution functions calculated from the scattering profiles using the program AUTOGNOM (27). (C–F) Ab initio and rigid-body SAXS reconstructions of the open state of full-length Mss116p (C), Mss116p/ΔC-tail (D), Mss116p/ΔNTE (E), and Mss116p/ΔNTE + ΔC-tail (F). Low-resolution envelopes calculated by DAMMIN are shown separately (Upper) and superposed onto atomic models determined by BUNCH (Lower). In this and other figures, protein domains are colored as in Fig. 1 and views are rotated by 90 ° about the vertical axis for each model.

