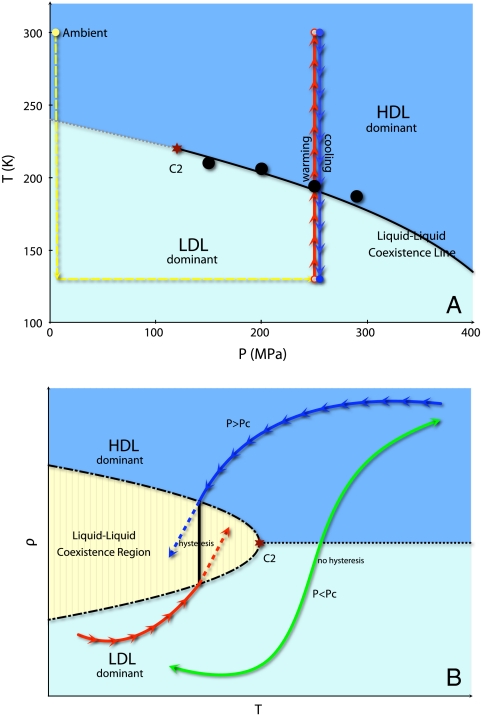
Fig. 1.
The hypothesized (A) T-P and (B) ρ-T phase diagrams of water in the presence of a first-order liquid–liquid phase transition are used to explain the motivation of our experimental procedures. In order to detect the hypothesized transition, both warming (red) and cooling (blue) scans were performed. If a first-order HDL-LDL transition indeed exists at high pressures, a hysteresis phenomenon should be observed because of the long time required for the phase separation, shown as the difference between the red and blue curves in B. However, at relatively low pressures, when no first-order line is crossed, there should be no hysteresis, shown with the green curve in B. The four black points in A are determined from the temperature of the maximum density difference at each pressure described later in the text. Note that further studies are required to identify the hypothesized liquid–liquid critical point C2.

