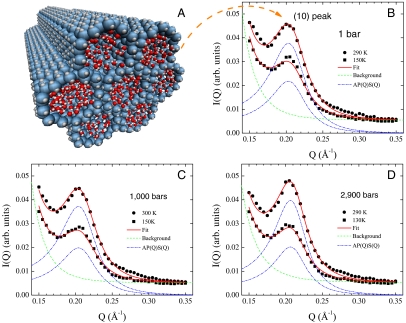
Fig. 2.
This figure demonstrates that the neutron diffraction intensities can be fitted with the model described in Materials and Methods. (A) Schematic representation of a D2O hydrated MCM-41-S nanoporous silica crystallite (pore diameter 2R≈15 Å ± 2 Å). (B–D) The elastic neutron diffraction intensity I(Q) at three pressures measured by SPINS at NCNR. The structure factor peak at around 0.21 Å-1 comes from the (10) plane of the 2D hexagonal arrangement of the water cylinders in the crystallite. The peak height is proportional to the square of the difference of neutron SLD between the confined D2O and the silica matrix and therefore is a sensitive indicator of the average mass density of D2O in the pores. By fitting with Eq. 1, the temperature-independent background (green dashed line) and the temperature-dependent elastic diffraction intensities (blue dash-dotted line) can be separated accordingly.

