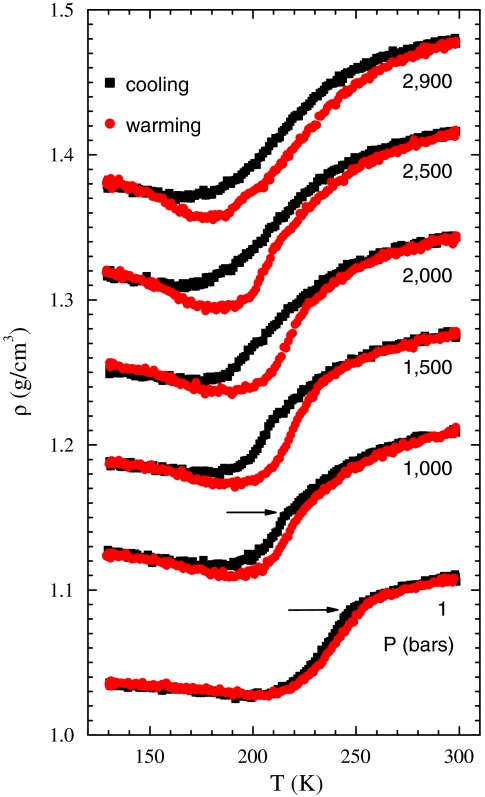
Fig. 3.
The density profiles of confined D2O in a hydrophilic substrate MCM-41-S are measured in both warming and cooling scans. The data are shifted by 0.05 g/cm3 between adjacent pressures for clarity. A hysteresis phenomenon becomes prominent above 1,000 bars. Error bars, due to counting statistics, in the density are smaller than the point size. The two horizontal arrows indicate the locations of the sudden change of slope in the density profiles (“kink”) at 1 bar and 1,000 bars.

