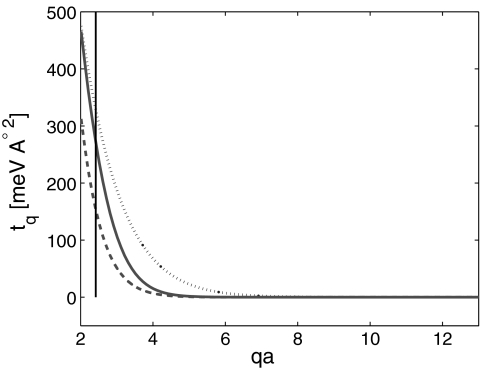
Fig. 2.
Hopping amplitude. The Fourier transform of the hopping amplitude is plotted vs. momentum (a is the carbon-carbon distance in single-layer graphene). The different curves correspond to different models described in refs. 19 (dotted), 22 (solid), and 23 (dashed). The vertical line crosses the x axis at kDa.

