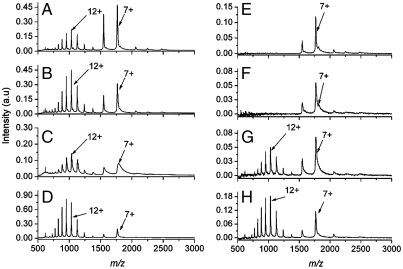
Fig. 1.
Mass spectra of cytochrome c as a function of electrospray solvent pH. The conventional ESI mass spectra of cytochrome c measured at pH (A) 7.18, (B) 6.07, (C) 5.06, and (D) 4.06. The mass spectra resulting from the femtosecond laser-induced vaporization of aqueous cytochrome c (pH 7) followed by capture and ionization in the electrospray plume at pH (E) 7.18, (F) 6.07, (G) 5.06, and (H) 4.06.

