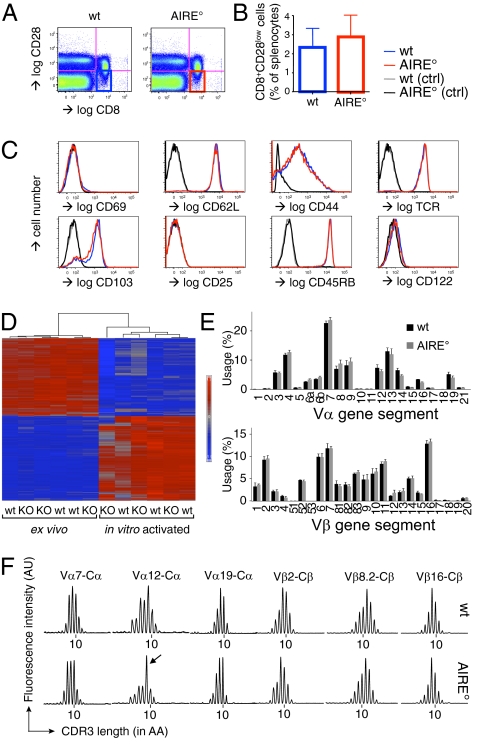
Fig. 1.
AIRE° and WT mice have normal numbers of transcriptionally and phenotypically unaltered CD8+CD28low Treg with similar but apparently distinct TCR repertoires. (A) Definition of WT (AIRE+/+) and AIRE° (AIRE°/°) C57BL/6 CD8+CD28low cells from spleen. Flow cytometry was performed using the indicated antibodies. (B) WT and AIRE° littermates had similar percentages of splenic CD8+CD28low Treg (gated as in A). Indicated are mean values ± SD (n = 3). (C) Phenotype of CD8+CD28low cells, electronically gated as shown in A. Expression profiles of markers indicated in the figure. Control (ctrl) stainings were performed using isotype-matched antibodies. Shown are typical results of three independently performed experiments. (D) Heatmap of the differentially expressed genes (according to fold change) in resting compared with activated, WT versus AIRE° CD8+CD28low Treg. Genes with statistical differential average expression (adjusted P < 0.05) with a fold change >2 when comparing activated and native cells are represented in this heatmap. Red indicates increased expression; blue indicates decreased expression. The dendrogram shows that WT and AIRE° (KO) samples are not clustering within the activated and native states. (E) Vα or Vβ segment use of WT versus AIRE° CD8+CD28low splenic Treg, as measured by semiquantitative RT-PCR. Indicated are mean values ± SD (n = 3 samples consisting of pooled cells from three mice). (F) CDR3 length distribution of indicated variable domains. Shown are typical results for indicated Vα and Vβ CDR3s. “10” indicates a CDR3 length of 10 amino acids; other peaks are separated by 3 nucleotides = 1 amino acid. Immunoscope results for all Vα and Vβ CDR3s for all analyzed mice are shown in Fig. S2 D and E. The arrow indicates the relatively increased signal for the 9-amino acid-long Vα12 CDR3 in AIRE° Treg.

