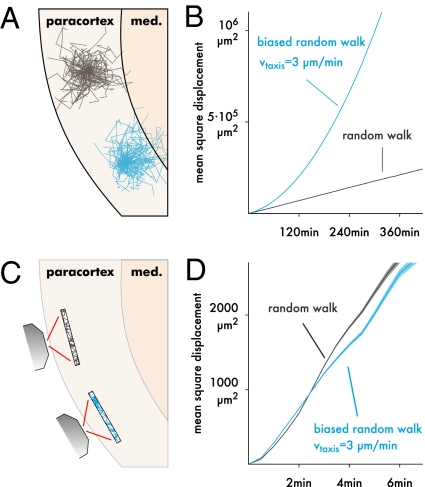
Fig. 3.
Displacement analysis can lead to wrong conclusions. (A) For example, assume that one subset of T cells (black) migrates purely randomly, whereas another subset (blue) performs taxis to the medulla. (B) If one could follow the cell populations for a very long time, the difference could be detected using a mean square displacement (MSD) plot, which is shown here for two simulated cell populations tracked for 6 h without placing bounds on the trajectories. Pure random walk (black; M = 100 μm2/min) leads to a linear MSD, and taxis (3 μm/min) gives a curved MSD. Data are averaged over 10,000 simulated cells, giving a negligibly small SEM. (C) Two-photon imaging is limited to a finite region in which faster cells are underrepresented, because they exit more quickly. (D) This effect can be reproduced by truncating the simulated data from B to a finite region (shading ± SEM for 10,000 simulated cells; region size = 492 × 492 × 40 μm as in our experimental setup). If we compared the two populations based on this plot alone, we would conclude that the blue population has lower motility (slope) and persistence (curvedness) than the black one, when in fact, the opposite is true.

