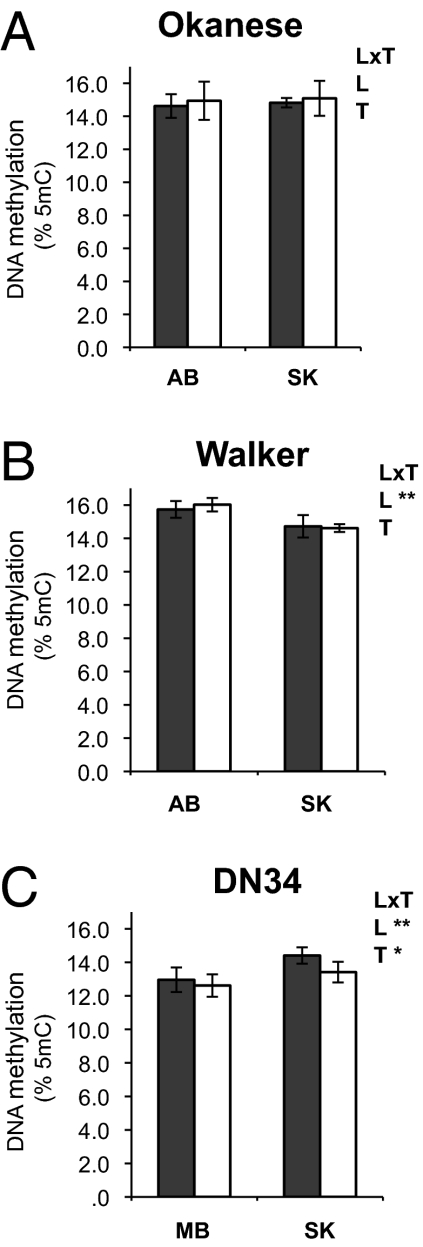
Fig. 4.
Global DNA methylation levels. Percentage of 5mC residues is given for plants grown under well watered (shaded bars) and water-limited (white bars) conditions for the Populus genotypes (A) Okanese, (B) Walker, and (C) DN34. For each graph, L indicates the location effect, T the treatment effect, and L×T the location:treatment interaction term (*P < 0.05, **P < 0.01). Mean values (n = 6; biological triplicates × technical duplicates) and SD bars are represented.

